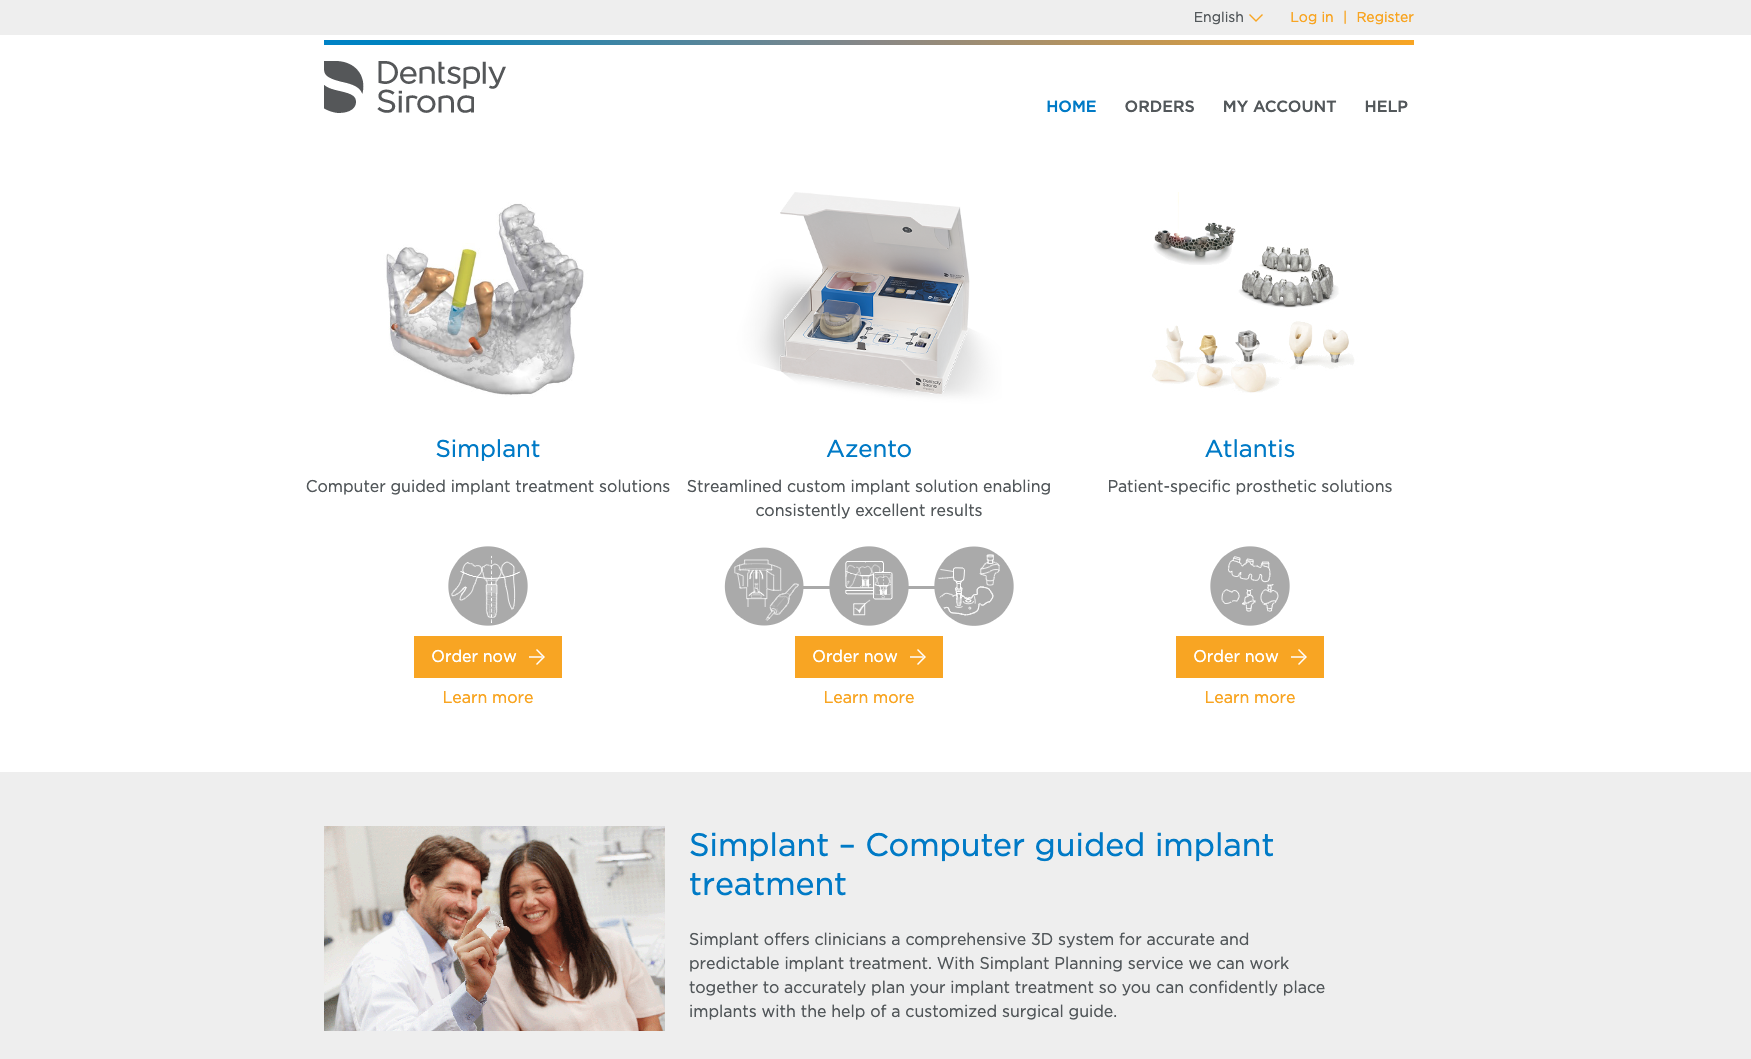

Dentsply Sirona Implant Customer-facing Digital Platform
Empowering dental professionals to provide better, safer and faster dental care
- Order and payment solutions of DS Core - Dentsply Sirona's open cloud-based platform transforming digital dentistry
- Lead a product team of product managers, product designers, and UX researchers for strategic projects via a customer-facing software platform. Reported to VP Marketing & Solution.
- The front-end program brings the customer-centered thinking, user experience, and agile culture to the software portfolio for ~100M€ digital implant business
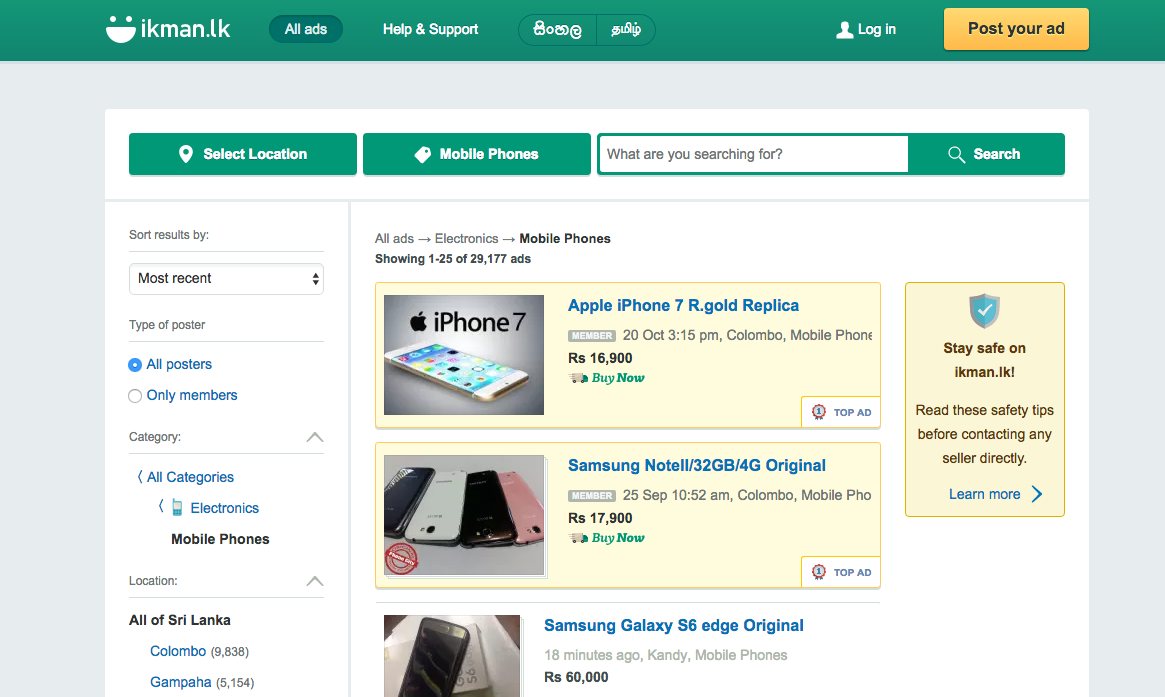
Online classifieds marketplace for emerging markets
Saltside Technologies AB
- Saltside creates online marketplaces: Bikroy, ikman, Tonaton, Efritin, for 4 emerging countries that serves 6 million+ visitors/month
- As a product owner, collaborated with distributed cross-functional team, turned stakeholders’ vision from sketch into features and products at multi-platforms (desktop/mobile web, iOS & Android apps, admin/payment/KPI system)
- Led major feature launches: Web Chat, Android Chat, Price matrix, Value voucher for premium listing, Market Delivers, Mobile push notification, CV upload, SEO improvement, etc.
Visualizing Obstructive Sleep Apnea Symptoms and Co-morbidities
Industrial and Systems Engineering Research Conference (ISERC) 2013
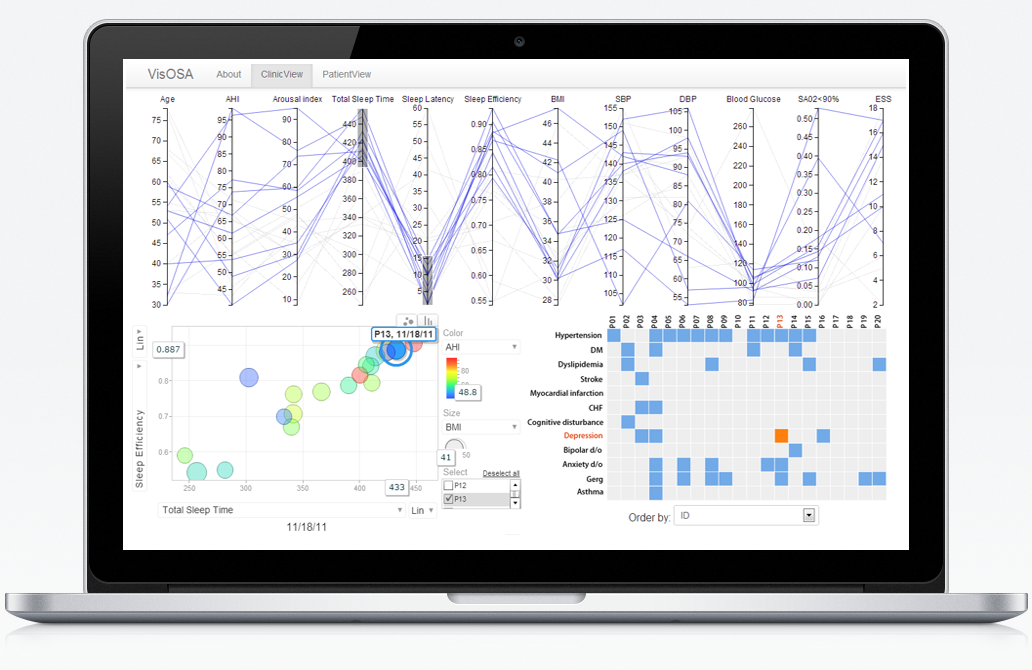
ABSTRACT:Obstructive Sleep Apnea (OSA) is a common chronic disorder associated with significant morbidity and mortality. As a first step towards creating patient supporting social network, this work aims to visually present and monitor the patient's health situation and treatment. As a result, a web-based prototype application is designed and implemented to facilitate rapid access to the patient data with the goal of reducing provider cognitive burden. The data is collected by reviewing consecutive medical records of adult patients with severe OSA. We categorize these data and organize them into suitable visual representations considering perceptual principles and design guidelines. The research contribution includes (1) a well-reasoned justification of how existing information visualization techniques can be usefully combined to present medical data; (2) the visual encoding and interaction mechanisms of comparing a given quantitative measurements against qualitative ranges, which is applicable to various domains in presenting laboratory test results.
Html/CSS/ JavaScript /Dashboard/Google Chart/D3/jQuery UIInvestigating Nanomaterial Toxicity Bibliography: A Network Analysis Approach
IEEE International Conference on Bioinformatics and Biomedicine 2013
ABSTRACT:The selection and prioritization of research directions is always a challenge. This paper aims to make sense of nanomaterial toxicity publication and keywords data through quantitative metrics and network visualization. We have adapted a combined approaches of network analysis, co-occurrence analysis, clustering analysis and visual analytics, to characterize important relational properties of network structures and features of entities. The results show that both co-authorship network and keywords network on nanomaterial toxicity follow the power-law degree distribution. In addition, the co-authorship network appears to be of scale-free pattern. We also investigate and visualize the research trends in field of nanomaterial toxicity by studying top influence researchers and keywords over years. These findings offer researchers various insights of the patterns and trends in the nanomaterial toxicity.
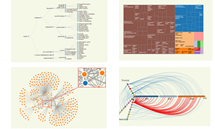
network science, visual analytics, co-authorship network, nanomaterial toxicityA User Centered Approach to Developing Information Visualization Module for NEIMiner
IEEE International Conference on Bioinformatics and Biomedicine Workshops (BIBMW) 2013
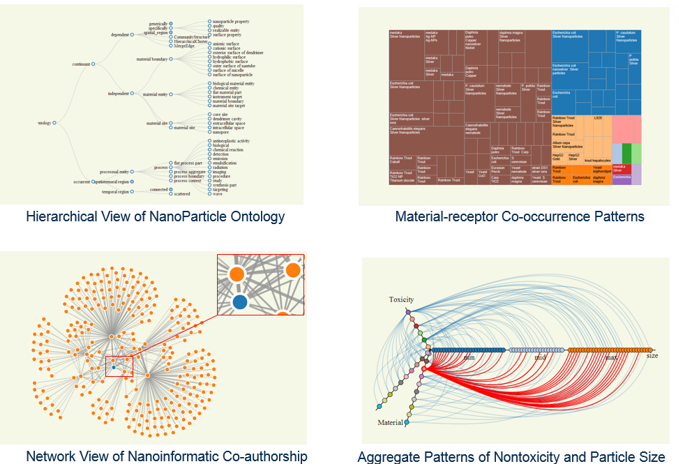
ABSTRACT: NEIMiner is an integrated information system for studying the nanomaterial environmental impact (NEI). However, there is a lack of visual analytic tools that efficiently query and present large-scaled bibliography meta-data and NEI characterizations in a meaningful way. This paper presents the design and implementation efforts of developing the information visualization (InfoVis) module for NEIMiner. We first describe a user centered design approach to identify the analysis tasks, to select suitable visual representations, and to iteratively validate and improve the development. We then show that how existing techniques, such as graph simplification, enriched visualization algorithms and interactive features, can be usefully combined to aid users gaining insights. We demonstrate the utility of InfoVis through scenarios of constructing co-authorship network, bibliography keywords network, and nanomaterial terms co-occurrence network. We implement our techniques as a Drupal module. Our design is supportive for analysts and researchers to identify concepts and relationships in studying environmental impact of nanomaterial.
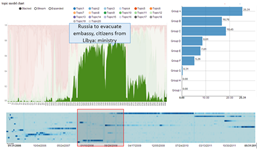
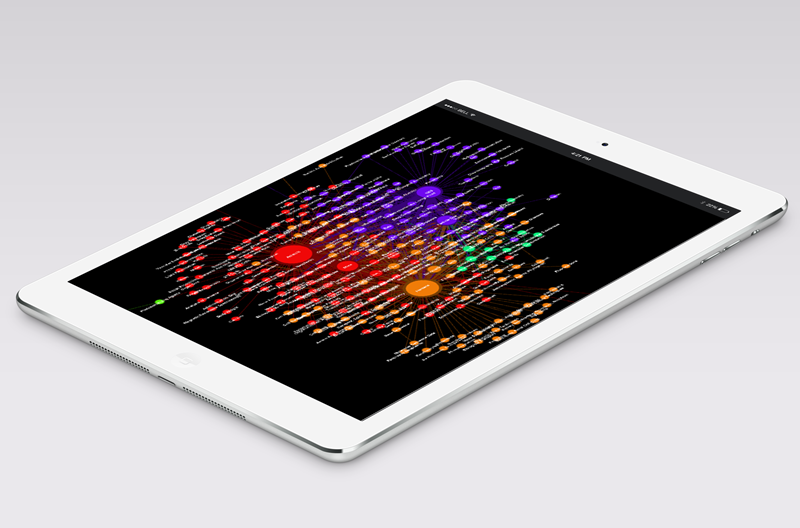
Information Viusalizaion/Drupal/Html/CSS/JavaScript/PHPHuman Social Cultural Behavioral Data Analytics
Internship work at Intelligent Automation, Inc.,2013 Summer
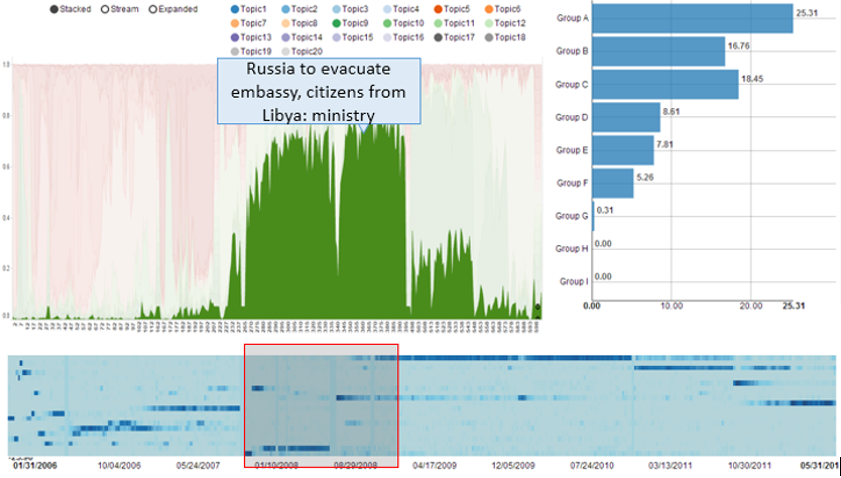
- Maintained data collection and extraction (2 GB tweets/day) to and from MongoDB
- Integrated topic modeling and sentiment analysis APIs to analyze 6+ million political tweets
- Designed and implemented web-based visual analytics tools to provide deep insights
- This system is the core of Scraawl
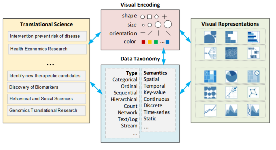
A Scalable Multi-Scale Visual Analytical Tool for Advancing Translational Sciences
SBIR Project by National Center for Advancing Translational Sciences (NCATS) at the National Institutes of Health (NIH)
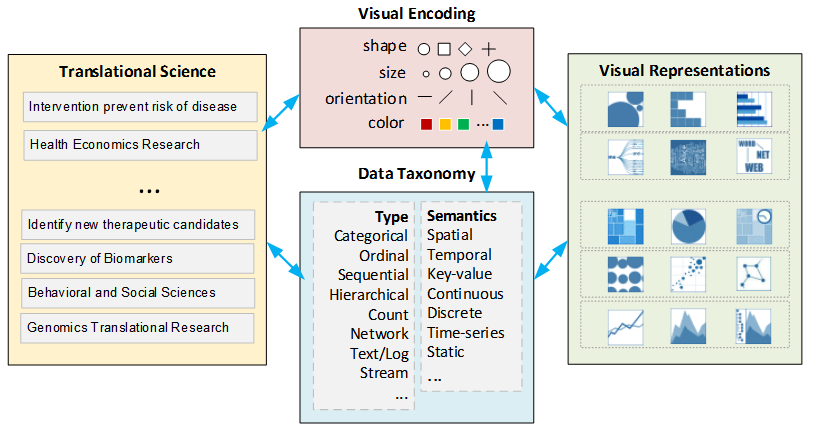
ABSTRACT: The Scalable Multi-Scale Visual Analytical Tool (SMS-VAT) for Advancing Translational Sciences aims to facilitate the translation of generated knowledge into applied clinical practice using interactive visualization. The platform consists of three components: (1) heterogeneous information extraction and mining for translational science, (2) integration of cubing architecture with powerful visualization, and (3) enhanced multi-scale visual analytics. We propose a taxonomy model that provides a high level of Data – Visualization – Translation Science mapping pipeline directly mapped domain knowledge with various data types and semantics to visual techniques for encoding data in a graphic. We create a typical use scenario with standardized reporting methods such as forest plot, Kaplan–Meier estimator, and STROBE for clinical decision making: intraoperative transfusion – which focuses on the anesthesia patient safety. Learn more here.
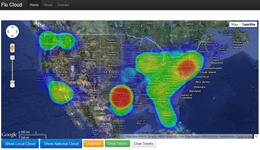
Information Visualization/ Translational Science/Html/CSS/JavaScript/D3.jsFlu Cloud
Webs, Clouds and Tweets: Using Social Media to Study the Spatial Dynamics of Influenza CIHDS Workshop 2012
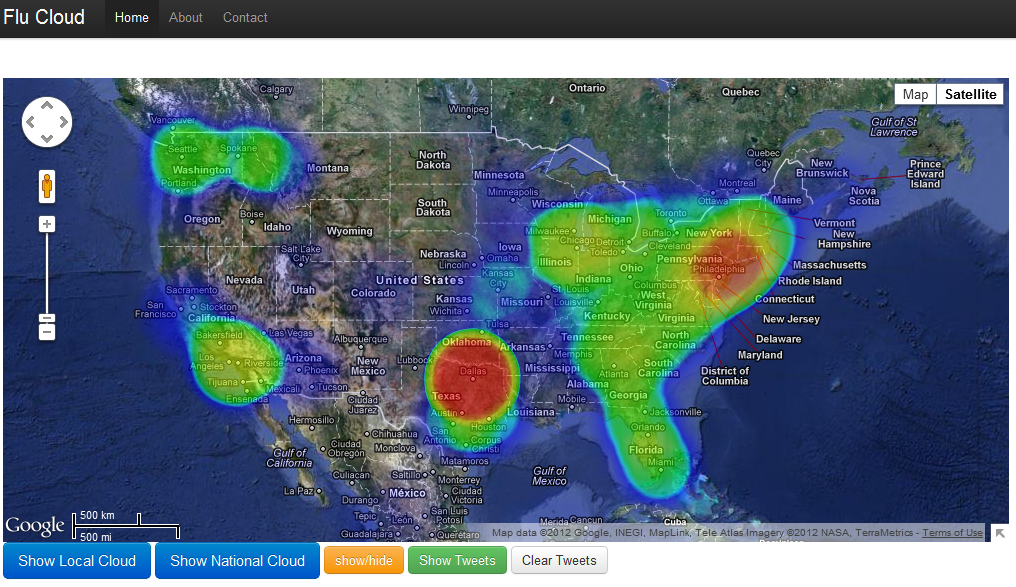
We introduced the concept of "Flu Cloud" which presented a spatial visualization of the Influenza-Like Illness (ILI) based on the results of density-based clustering. The proposed Flu Cloud is like the weather map produced by satellites in weather forecasting: it maps the flu related tweets with coordinates into density based clusters for the general population. Public available tweets streaming provides the possibility of updating the Flu Cloud in near real time. In the long term, detecting the movement of the Flu Cloud over time helps the understanding and prediction of the dynamic trends of Influenza in high-resolution.
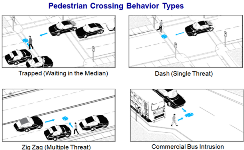
PHP/MySQL/XML/JavaScript/ Python NLTK/ NetworkX/Google Map APIPedestrian Density and Crossing Behavior Study for Intersection Redesign
Charles Bergman, Amey Farde, Monifa Vaughn-Cooke, Hui Yang. Human Factors and Ergonomics Society (HFES) Design Committee, University Park, PA, USA, 2012
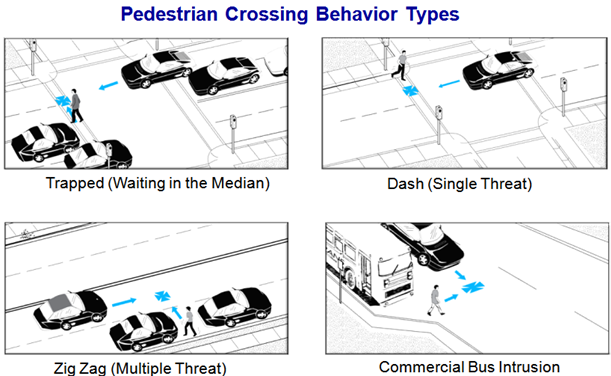
The intersection of Atherton St. and Railroad Ave. in State College, PA was identified as a high-risk intersection due to a large pedestrian volume, accident rates and a current crossing design that encourages risky pedestrian behavior. Several factors influence a pedestrian's crossing behavior and the choice to adhere to crossing regulations. Risky crossing behavior compromises the safety of both pedestrians and motorists. The study aims to capture, code and analyze pedestrian crossing behavior at the Atherton/Railroad intersection. After identifying the predominant types of behavior and the highest density crossing times, the design Committee proposed design alternatives to support pedestrian adherence to crossing regulations and potentially reduce accidents.
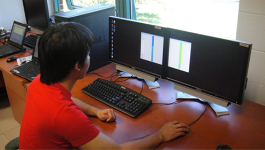
Qualitative user research/Video recording/Observation/Code human behaviorsInvestigating the Mouse Cursor Movement Time in Multiple Monitors Work Environment, a Pilot Study
Master Thesis in Human Computer Interaction, Uppsala University, 2011
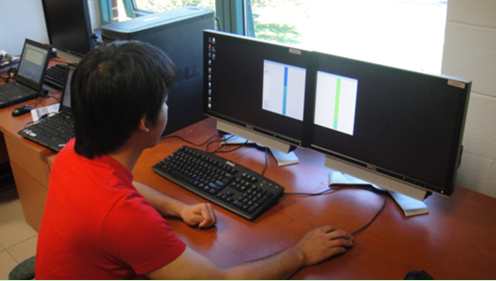
This study investigates the factors that affect movement and tracking mouse cursor in computer-based work with multi-monitors. The study aims to explore how the display objects' width, amplitude, and gap distance between dual monitors affect movement time of mouse cursor. The objectives also include identifying potential obstacles within the multi-monitor working places. A within-subjects experiment involving five subjects was designed and conducted to access the performance of the participants in one dimensional pointing-and-clicking task. We applied regression analysis and the analyses of variance (ANOVAs) to analyze the factorial design. The results of the pilot study show that the physical gap distance is a potential obstacle within the multi-monitor work places of screens. In addition, we applied the regression models in different forms and compare their fitness. The results show that the modified Fitts' law model with obstacle component, as compare with the original Fitts' law model, provides a better fit for the movement time in all presented levels of gaps between the dual monitors.
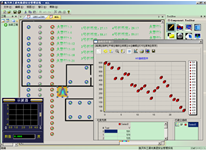
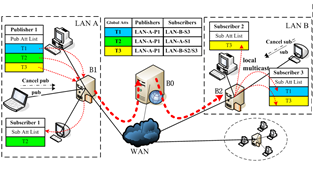
Qualitative user research/ C#/Visual Studio/SPSS/Regression/ANOVA/NASA-TLXA Multi-node Information Exchange Mechanism for Virtual Test System
Computer Simulation. 2010, 27(6)
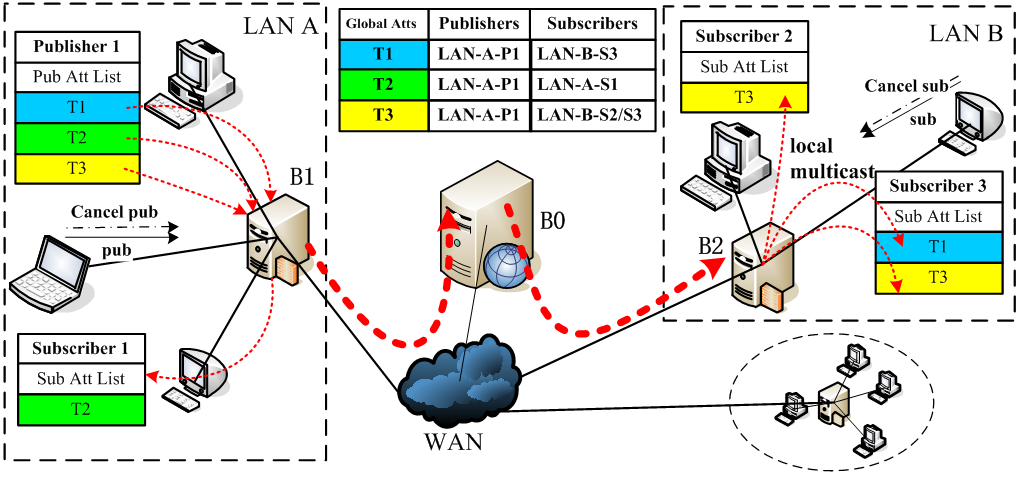
ABSTRACT:In distributed and scalable virtual test,virtual equipments located in multiple nodes are connected together by local and wide area network to complete the virtual testing tasks for advanced equipments.During the process of testing task,each participating node has to send corresponding state and data to the others through the test platform.Therefore,it calls for a data exchange mechanism which can effectively support the running of virtual test system.This study describes a multi-node information exchange mechanism,which aims at achieving layered communication management,eliminating tightly coupled communication and reducing redundant information transmission.The work presented focuses on several aspects including hierarchical architecture,theme-based publish/subscribe paradigm and reliable unicast / local multicast combined communication,which can meet the actual needs in virtual test.
.NET/Visual Studio/GDI+/MFC/COM/ADOInvestigating the Adjustability of the Seat in SAE Class-B Heavy Truck Using Digital Human Model (DHM) Jack
Course project: Designing for Human Variability, 2010
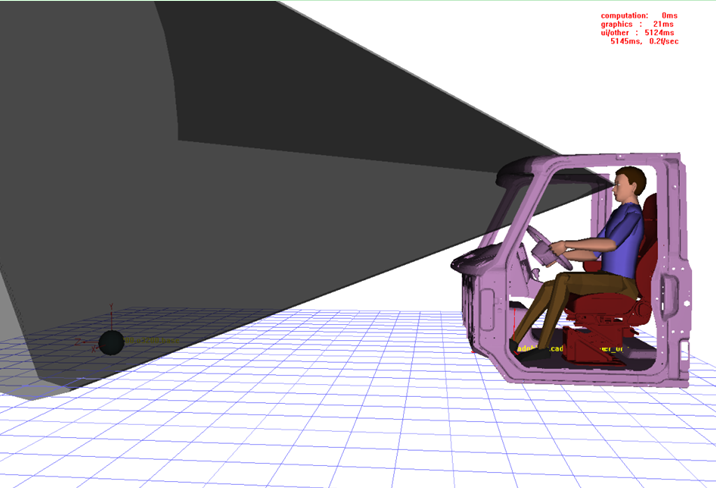
The project is to determine the adjustability of the seat in SAE Class-B heavy truck based on Digital Human Model (DHM) Jack, considering the accommodations in headroom, legroom and visibility. H-point represents the approximate location of the seat where the driver's hips would be located. After obtaining the nine DHM in a range of stature and mass (5th,50th,95th Stature, 5th,50th,95th Mass), the next stop is to fit the model in the Class-B heavy truck cab. Taking all the data that collected in the Jack 5.1 system, in figure 2, the area in the red box is the range of adjustability of the H-point in both the vertical and horizontal directions for SAE Class-B heavy truck.
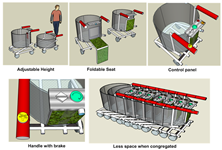
Qualitative ergonomics study /Anthropometry /Digital Human ModelInnovative Design of Shopping Cart
Course Project: Advanced Interaction Design, 2009
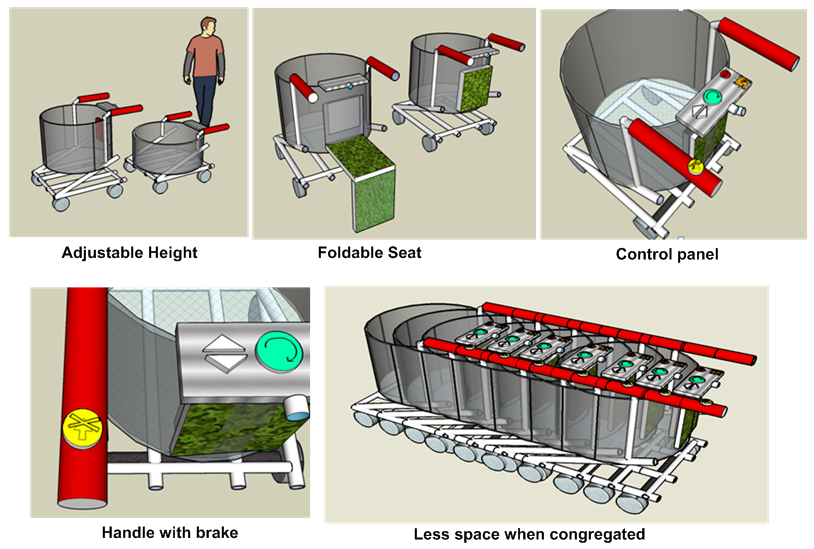
The project provides 3D model and conceptual design for shopping cart with more accessibility and functions for disable people and senior population. Key features are as follows
Universal Design/Google SketchUp/ High-fidelity prototype/3D ModelUsability Evaluation of Salary Statistics Website
Hui Yang, Qi Zhang, Romel Ayalew.Lonestatistik AB & Usability Lab at Ekonomikum, Stockholm, Sweden,2009
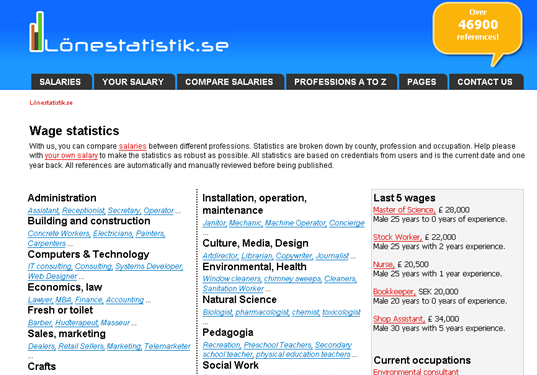
- Worked as a core member, collaborating with 5 members to execute the whole usability testing lifecycle
- Recruited 32 participants, designed the pre- and post-questionnaires
- Analyzed the statistics of representative target users based on Morae platform
- Conducted data analysis using SPSS
- Proposed redesign guideline to improve effectiveness, efficiency and satisfaction
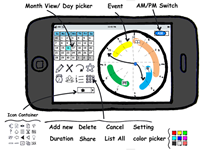
MicroCal:a Prototype Design of iphone Calendar
Course Project for Advanced Interaction Design, 2009
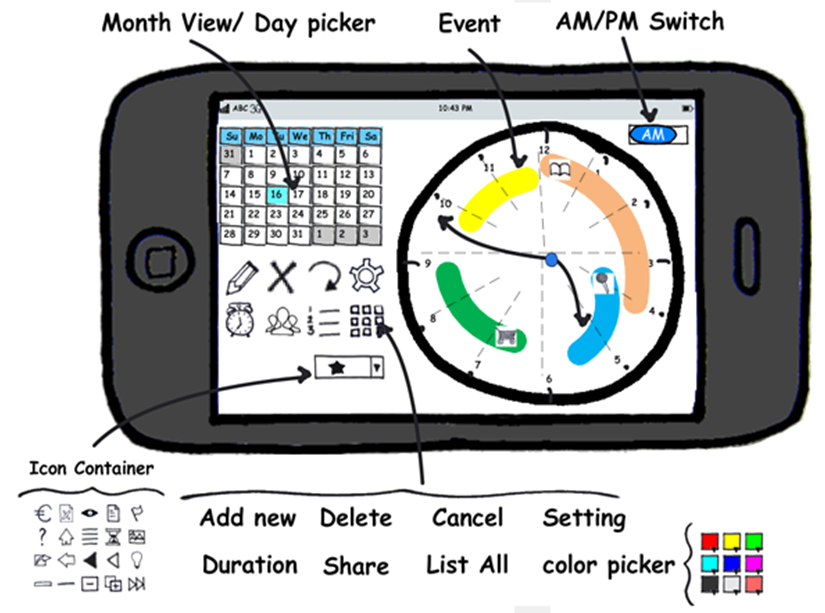
In this project, we present a prototype design of iphone calendar application, named MicroCal, for young people and teenagers. We provide a user-friendly approach of interaction to create a customized user experience. The design of dial interface makes it different from the regular calendar in appearance which creates a fashionable and customized users interface. The design concepts also take advantage of the multi-touch technology to simplify the interaction. You may notice that the similar layout we proposed in 2009 is now widely used in smartwatch
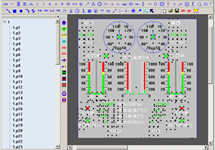
UI Design/ Low-fi prototyping for mobile devicesDistributed Semi-physical Avionics Design & Simulation Platform
Project Sponsor: Jiangxi HONGDU Aviation Industry Group Co., Ltd, Nanchang, China, 2007
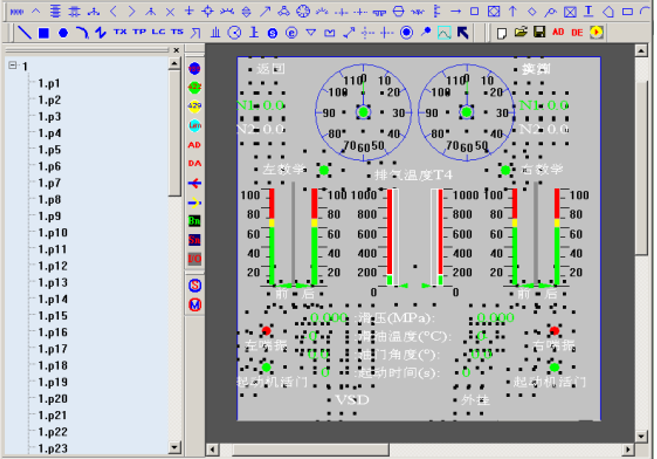
- Worked as a Core member, collaborating with 3 members to develop a graphical platform to simulate and design the pilot operation interface and avionics.
- Established the avionics equipment behavior model, attribute model and interface model
- Completed the GDM&SP .COM component - avionics system control kit by DLL package
- Implemented the distributed real-time simulation for a variety of avionics, including Pilot Operation Procedure (POP), ADC, Inertial Navigation System (INS), TACAN and Altimeter
Distributed Real-Time Enterprise Security Platform
Project Sponsor: Nanjing Chenguang Group Co.,Ltd (NCGC), Nanjing, China, 2008
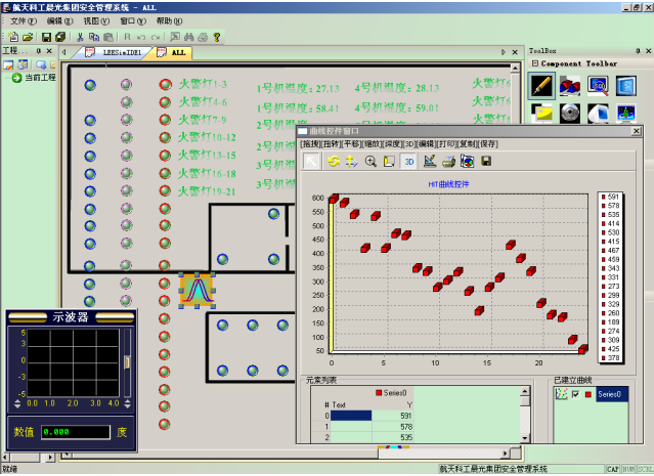
- Design and Develop a dashboard to monitor the real-time temperature and fire alarm in production area, storage and assembly room through the enterprise local area network
- Supporting various communication protocols, including MIL-STD-1553, RS232/422, ARINC 429 and TCP/IP through the universal communication model and algorithm
- Developed General Graph Controller by repackaging the TeeChart API for the universal interface structure
- Established Universal Database Control, supporting SQL Server, Oracle, FoxPro, MS-Access, etc.
- Instructed the enterprise safety engineers for the Platform